ค้นหาบล็อกนี้
โพสต์

Basic Trading Chart Analysis | Chart Patterns

Basic Trading Chart Analysis | Support and Resistance

วางแผนการเงินในยุคดิจิทัล | Financial Planning in the Digital Age
Chart Patterns in Forex Trading คู่มือฉบับสมบูรณ์ (Chart Patterns Forex Trading Guide)
Introduction to Chart Patterns in Forex Trading
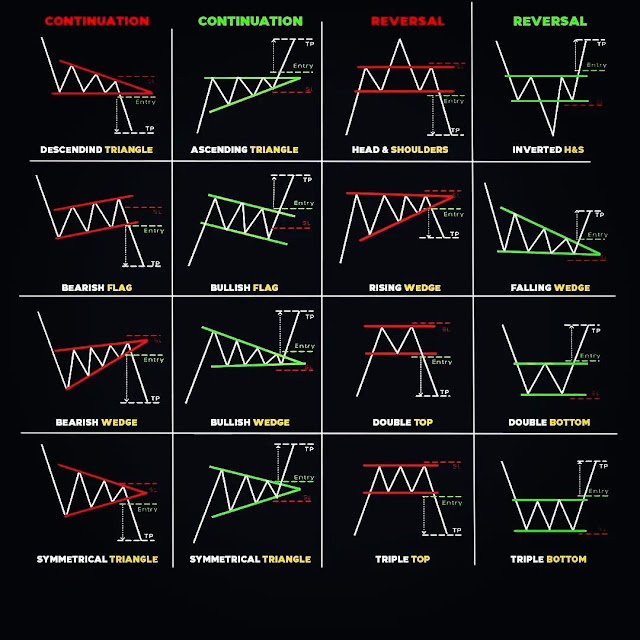
ในโลกของการเทรด Forex, การเข้าใจ “Chart Patterns” หรือ รูปแบบกราฟ เป็นสิ่งสำคัญที่ช่วยให้เทรดเดอร์สามารถคาดการณ์ทิศทางราคาของคู่เงินได้อย่างแม่นยำมากขึ้น. Chart Patterns เป็นรูปแบบที่ปรากฏบนกราฟราคาซึ่งบ่งบอกถึงแนวโน้มการเคลื่อนไหวของราคาในอนาคต.
In Forex trading, understanding chart patterns is crucial. These patterns appear on price charts and can signal future price movements.
Types of Chart Patterns (ประเภทของ Chart Patterns)
1. Head and Shoulders (หัวและไหล่)
- Head and Shoulders เป็นรูปแบบที่บ่งบอกถึงการเปลี่ยนแปลงแนวโน้ม. ในแบบ Head and Shoulders, คุณจะเห็น 3 จุดสูงสุด (Shoulders) และ 1 จุดสูงสุดสูงสุด (Head) ซึ่งบ่งบอกถึงการกลับตัวของแนวโน้ม.
The Head and Shoulders pattern signals a trend reversal. It consists of three peaks (Shoulders) and one higher peak (Head), indicating a potential shift in trend.
2. Double Top and Double Bottom (Double Top และ Double Bottom)
- Double Top เป็นรูปแบบที่บ่งบอกถึงการกลับตัวของแนวโน้มขาขึ้น. คุณจะเห็น 2 จุดสูงสุดที่เท่ากัน, ซึ่งแสดงถึงการอ่อนตัวของแรงซื้อ.
- Double Bottom เป็นรูปแบบที่บ่งบอกถึงการกลับตัวของแนวโน้มขาลง. คุณจะเห็น 2 จุดต่ำสุดที่เท่ากัน, ซึ่งแสดงถึงการเริ่มต้นของแรงซื้อ.
Double Top signals a bearish trend reversal with two equal peaks, while Double Bottom indicates a bullish reversal with two equal troughs.
3. Triangles (รูปแบบสามเหลี่ยม)
- Ascending Triangle เป็นรูปแบบที่บ่งบอกถึงการเพิ่มขึ้นของแรงซื้อ, โดยมีแนวโน้มที่สร้างจุดสูงขึ้นเรื่อยๆ.
- Descending Triangle บ่งบอกถึงการลดลงของแรงซื้อ, โดยมีแนวโน้มที่สร้างจุดต่ำลงเรื่อยๆ.
- Symmetrical Triangle เป็นรูปแบบที่แสดงถึงการควบคุมของตลาดในระยะสั้น, โดยคาดหวังว่าราคาจะเคลื่อนไหวอย่างรวดเร็วเมื่อออกจากรูปแบบนี้.
Triangles are continuation patterns. The Ascending Triangle indicates bullish strength, the Descending Triangle shows bearish strength, and the Symmetrical Triangle suggests a period of consolidation.
How to Use Chart Patterns in Forex Trading (การใช้ Chart Patterns ในการเทรด Forex)
1. Identify the Pattern (การระบุรูปแบบ)
- การรู้จักและเข้าใจรูปแบบต่างๆ บนกราฟจะช่วยให้คุณสามารถคาดการณ์ทิศทางราคาของคู่เงินได้อย่างแม่นยำ.
2. Confirm the Pattern (การยืนยันรูปแบบ)
- ใช้เครื่องมือเพิ่มเติมเช่น Indicator หรือ Volume เพื่อยืนยันว่ารูปแบบที่คุณเห็นนั้นมีความน่าเชื่อถือ.
3. Implement the Trading Strategy (การนำกลยุทธ์การเทรดไปใช้)
- การตั้ง Stop Loss และ Take Profit ตามจุดที่เหมาะสมเพื่อจัดการความเสี่ยง.
To effectively use chart patterns, identify the pattern, confirm it with additional tools, and implement a trading strategy with proper risk management.
Conclusion (สรุป) Chart Patterns in Forex Trading คู่มือฉบับสมบูรณ์
การเข้าใจและใช้ “Chart Patterns” เป็นทักษะที่สำคัญสำหรับ Forex Trader ที่ต้องการเพิ่มความแม่นยำในการคาดการณ์ทิศทางราคา. ด้วยการศึกษาและฝึกฝน, คุณจะสามารถปรับใช้รูปแบบกราฟเหล่านี้ในกลยุทธ์การเทรดของคุณได้อย่างมีประสิทธิภาพ.
Understanding and utilizing chart patterns is essential for Forex traders seeking to improve their prediction accuracy. With study and practice, you can effectively integrate these patterns into your trading strategies.
Advanced Chart Patterns in Forex Trading
1. Cup and Handle (ถ้วยและหูจับ)
Cup and Handle เป็นรูปแบบกราฟที่บ่งบอกถึงการกลับตัวของแนวโน้มจากขาลงเป็นขาขึ้น โดยมีลักษณะเป็นรูปถ้วยที่มีหูจับอยู่ด้านข้าง.
- Cup Formation: รูปแบบนี้เกิดขึ้นเมื่อราคามีการลดลงและค่อยๆ ฟื้นตัวกลับมาในรูปของการก่อตัวของถ้วย.
- Handle Formation: หลังจากที่มีการฟื้นตัวในรูปของถ้วย, ราคาจะเกิดการเคลื่อนไหวในแนวนอนหรือลงเล็กน้อยเพื่อสร้างหูจับ.
This pattern signals a bullish trend after a consolidation phase. The cup is the consolidation phase, while the handle is the final pullback before a breakout.
2. Flag and Pennant Patterns (ธงและธงเพนนานต์)
Flag and Pennant เป็นรูปแบบกราฟที่บ่งบอกถึงการดำเนินการต่อเนื่องของแนวโน้มหลังจากที่เกิดการเคลื่อนไหวที่รุนแรง.
- Flag Pattern: แสดงถึงการเคลื่อนไหวที่ค่อนข้างคงที่ในทิศทางตรงข้ามกับแนวโน้มหลัก เช่นการสร้างธงขึ้นหลังจากการเคลื่อนไหวที่สูงขึ้น.
- Pennant Pattern: คล้ายกับธง แต่มีลักษณะเป็นรูปสามเหลี่ยมที่แคบลงและเกิดขึ้นหลังจากการเคลื่อนไหวที่รุนแรง.
Both patterns indicate a continuation of the current trend. The flag is a rectangular consolidation pattern, while the pennant is a small symmetrical triangle.
3. Gaps (ช่องว่าง)
Gaps เป็นช่องว่างที่ปรากฏบนกราฟราคาซึ่งเกิดขึ้นเมื่อราคาเปิดที่สูงหรือต่ำกว่าราคาปิดของวันก่อนหน้า.
- Common Gaps: ช่องว่างที่เกิดขึ้นในช่วงการซื้อขายปกติและมักจะถูกเติมเต็มในระยะเวลาอันสั้น.
- Breakaway Gaps: ช่องว่างที่เกิดขึ้นเมื่อราคาผ่านระดับแนวรับหรือแนวต้านที่สำคัญ.
- Exhaustion Gaps: ช่องว่างที่เกิดขึ้นเมื่อแนวโน้มที่แข็งแกร่งกำลังจะสิ้นสุด.
- Runaway Gaps: ช่องว่างที่เกิดขึ้นในระหว่างการเคลื่อนไหวที่รุนแรงและแสดงถึงการดำเนินต่อของแนวโน้ม.
Gaps provide clues about future price movements based on their type and context. They often signal the continuation or reversal of a trend.
Technical Indicators and Chart Patterns
1. Moving Averages (ค่าเฉลี่ยเคลื่อนที่)
Moving Averages เป็นเครื่องมือที่ใช้ในการทำให้แนวโน้มของราคาเป็นไปตามเวลาเพื่อช่วยให้เห็นภาพรวมของแนวโน้ม.
- Simple Moving Average (SMA): การคำนวณค่าเฉลี่ยของราคาปิดในช่วงเวลาที่กำหนด.
- Exponential Moving Average (EMA): การคำนวณค่าเฉลี่ยที่ให้ความสำคัญกับข้อมูลล่าสุดมากกว่าข้อมูลเก่า.
Moving Averages help smooth out price data and identify the direction of the trend. They can be used in conjunction with chart patterns to confirm signals.
2. Relative Strength Index (RSI) (ดัชนีความแข็งแกร่งสัมพัทธ์)
RSI เป็นเครื่องมือที่ใช้วัดความแรงของแนวโน้มและสัญญาณที่อาจเกิดการกลับตัว.
- Overbought Condition: RSI ที่สูงกว่าค่า 70 อาจบ่งบอกถึงตลาดที่ซื้อเกินไป.
- Oversold Condition: RSI ที่ต่ำกว่าค่า 30 อาจบ่งบอกถึงตลาดที่ขายเกินไป.
RSI helps identify potential reversal points by measuring the speed and change of price movements.
Integrating Chart Patterns with Fundamental Analysis
การใช้ Chart Patterns ควบคู่กับการวิเคราะห์พื้นฐาน (Fundamental Analysis) สามารถช่วยให้การตัดสินใจในการเทรดมีความแม่นยำมากขึ้น.
- Economic Indicators: ใช้ข้อมูลทางเศรษฐกิจ เช่น GDP, อัตราการว่างงาน และอัตราดอกเบี้ย เพื่อเข้าใจแนวโน้มตลาด.
- Geopolitical Events: เหตุการณ์ทางการเมืองและเศรษฐกิจที่สำคัญสามารถส่งผลกระทบต่อราคาของคู่เงิน.
Combining chart patterns with fundamental analysis provides a more comprehensive view of the market and improves decision-making.
Ads
BANNER
Most Popular
จำนวนการดูหน้าเว็บรวม
Popular Post

Basic Trading Chart Analysis | Chart Patterns

Basic Trading Chart Analysis | Support and Resistance

วางแผนการเงินในยุคดิจิทัล | Financial Planning in the Digital Age
.png)
การวางแผนงบประมาณ Budget planning


.png)

0 ความคิดเห็น